CASHFLOW ARCHITECTURE BRIEFING // SEASON 1, EPISODE 01 EXECUTIVE INTELLIGENCE BRIEFING
AAPL 6/14 ACTIVE GATES

What does Apple Really Sell?

In 2007, Microsoft CEO Steve Ballmer laughed on camera at the iPhone, claiming a $500 device with no physical keyboard could never capture enterprise market share. Today, Apple captures over 85% of all global smartphone operating profits. The world assumes Apple is an ultra-premium hardware manufacturer selling glass and aluminum devices. That is what is SEEN.

LIVE MATRIX PREVIEW
THE 7 MONEY GATES™ INTERACTIVE CANVAS

Want to skip the story and explore the interactive matrix showing all the gates this brand uses?

Test your commercial intuition: click to reveal the unseen cash engines, explore all 14 physical & digital gates, and see the exact mechanics this enterprise uses to extract profit.

FORENSIC CASE STUDY

The Anatomy of Apple's Commercial Genius

ACT I // THE INCUMBENT BLUNDER 01

The $500 Phone With No Keyboard

Back in January 2007, the mobile phone market was run like a medieval cartel. Handset makers—Motorola, Nokia, Samsung, and BlackBerry—groveled before wireless carriers. At the time, cellular carriers dictated what software could be installed, slapped ugly logos onto the plastic casing, and loaded devices with overpriced ringtone stores and broken web browsers.

The dominant assumption across the industry was that phones were disposable plastic containers meant only to bill cellular minutes. When Steve Jobs unveiled the original iPhone, Microsoft CEO Steve Ballmer famously laughed on camera, insisting that a $500 phone with no physical keyboard had zero appeal to business executives. Over at BlackBerry, engineers tore the iPhone apart in disbelief, convinced it was an impossible hardware hoax that would crash cellular cell towers.

"Five hundred dollars? Fully subsidized? With a plan? That is the most expensive phone in the world. And it doesn't appeal to business customers because it doesn't have a keyboard."

— Steve Ballmer, CEO of Microsoft (January 2007)
ACT II // THE STRUCTURAL COUP 02

Inverting the Carrier Cartel

Steve Jobs didn't just build a sleek glass multi-touch screen; he pulled off one of the boldest leverage plays in business history.

Jobs turned the entire carrier power dynamic inside out. Instead of begging AT&T for shelf space, Apple offered an ultimatum never before heard in telecom: grant Apple 100% total control over the software, ban all carrier bloatware, and hand over a recurring slice of monthly cellular bills—or Apple would walk straight to Verizon.

Desperate for exclusive data traffic, AT&T blinked and agreed. For the first time in telecom history, a phone maker completely owned the customer relationship. By cutting the carrier out of the operating system layer, Jobs turned a consumer gadget into an inescapable digital border crossing.

ACT III // THE UNSEEN CASH ENGINES 03

The Three Tollbooths Funding Apple's $3 Trillion Valuation

Most analysts still look at Apple as a hardware company with a healthy services side-hustle. In reality, Tim Cook transformed Apple into a sovereign digital tax authority. Once you buy an iPhone, Apple quietly taxes every app download, every internet search, and every fear of accidental screen damage.

THE UNSEEN TOLLBOOTHS

How The Cash Actually Moves

01 Brand Gate
The $20 Billion Safari Default Search Royalty

Under the historic U.S. DOJ v. Google antitrust trial disclosures, the tech industry's best-kept secret was revealed: Google pays Apple an estimated 36% of all search advertising revenue generated through Safari on iOS. That single check amounts to roughly $20 Billion annually in pure, zero-marginal-cost profit for Apple simply to keep Google as the default search engine on 2 billion active devices.

FORENSIC METRIC $20B / Year (100% Margin)
Source: U.S. DOJ v. Google Antitrust Trial Exhibits
02 Access Gate
The App Store 30% Border Tax

Apple created an enclosed digital nation-state. If an iOS developer wants to distribute software, subscriptions, or digital goods to an iPhone owner, they must pass through Apple's proprietary payment rails. Apple collects a 15% to 30% toll on every transaction with near-zero marginal server distribution cost, generating an estimated $25B+ in high-margin cashflow annually.

FORENSIC METRIC 30% Digital Border Toll
Source: Apple Inc. FY2024 Form 10-K, Item 7: Services Net Sales & Margin Analysis
03 Risk Gate
AppleCare+ & The Hidden Insurance Float

AppleCare+ is rarely analyzed by financial commentators as an insurance operation, but that is precisely what it is. With industry-estimated loss ratios under 20%, AppleCare+ charges recurring monthly premiums for device peace of mind. Because Apple controls its own certified refurbishment supply chain, actual claim fulfillment costs are negligible—turning device insurance into an 80%+ gross margin cash machine.

FORENSIC METRIC 80%+ Estimated Gross Margin
Source: Apple Inc. FY2024 Form 10-K, Note 1: Extended Warranty and Service Contracts (AppleCare)
THE SEEN ENGINE
$223B

Apple Hardware Revenue

The one in every article. The one analysts track. The one that makes headlines every product launch.

Source: Apple FY2024 Earnings
THE UNSEEN ENGINE
$100B+

Apple Services Run Rate

iCloud, AppleCare+, App Store advertising, Apple Music, Apple TV+, Apple One. Running quietly underneath every hardware sale.

Source: CNBC / Apple FY2024 Earnings

The real wealth is in what is NOT SEEN—how Apple uses 2.2 billion active devices as an inescapable digital toll road, extracting over $100B in high-margin services, 30% App Store commission taxes, and a staggering $20B annual cash payment from Google simply to maintain Google as the default search engine on Safari.

But which money gates does Apple Inc. use to stack this cashflow? Click each ? to reveal how they use that gate.

AGENT // PROFIT OPENER THE SEEN (PHYSICAL/DIGITAL) THE UNSEEN (PHYSICAL/DIGITAL)
1. Products
ACTIVE · SEEN High-End Consumer Hardware Retailing premium physical devices (iPhones, iPads, MacBooks, Apple Watches) at high hardware margins.
—
2. Services
ACTIVE · SEEN Apple Store Genius Bar Support On-site diagnostic consultations and physical repairs inside their retail stores.
—
3. Access —
4. Attention —
5. Money — —
6. Risk —
7. Brand —
STEP 03

Strategic Translation

The underlying economic infrastructure driving this profit extraction design.

01

What is the explicit promise the customer buys?

Premium hardware devices sold globally.

02

What asset is quietly accumulating as a result?

A locked-in active user base of over 2 billion devices.

STEP 04

Boardroom Strategy Takeaway

Commercial architecture analysis & operational directives for executive decision-makers.

PO
EXECUTIVE STRATEGY TAKEAWAY

Hardware is the distribution channel; the digital ecosystem is the monetization engine.

FOR SMEs & OPERATORS Pragmatic Implementation

Prerequisite Condition: If you sell a physical product or a one-time service, you must build a digital ecosystem around it to capture recurring cashflow.

Actionable Blueprint: A premium coffee machine brand started selling smart coffee makers at cost, then charged a monthly subscription for personalized coffee bean replenishment and recipe access.

📖 VIEW THE 14 PROFIT OPENERS FRAMEWORK GUIDE ▼
THE FRAMEWORK // FOR REFERENCE

The 14 Profit Openers Explained

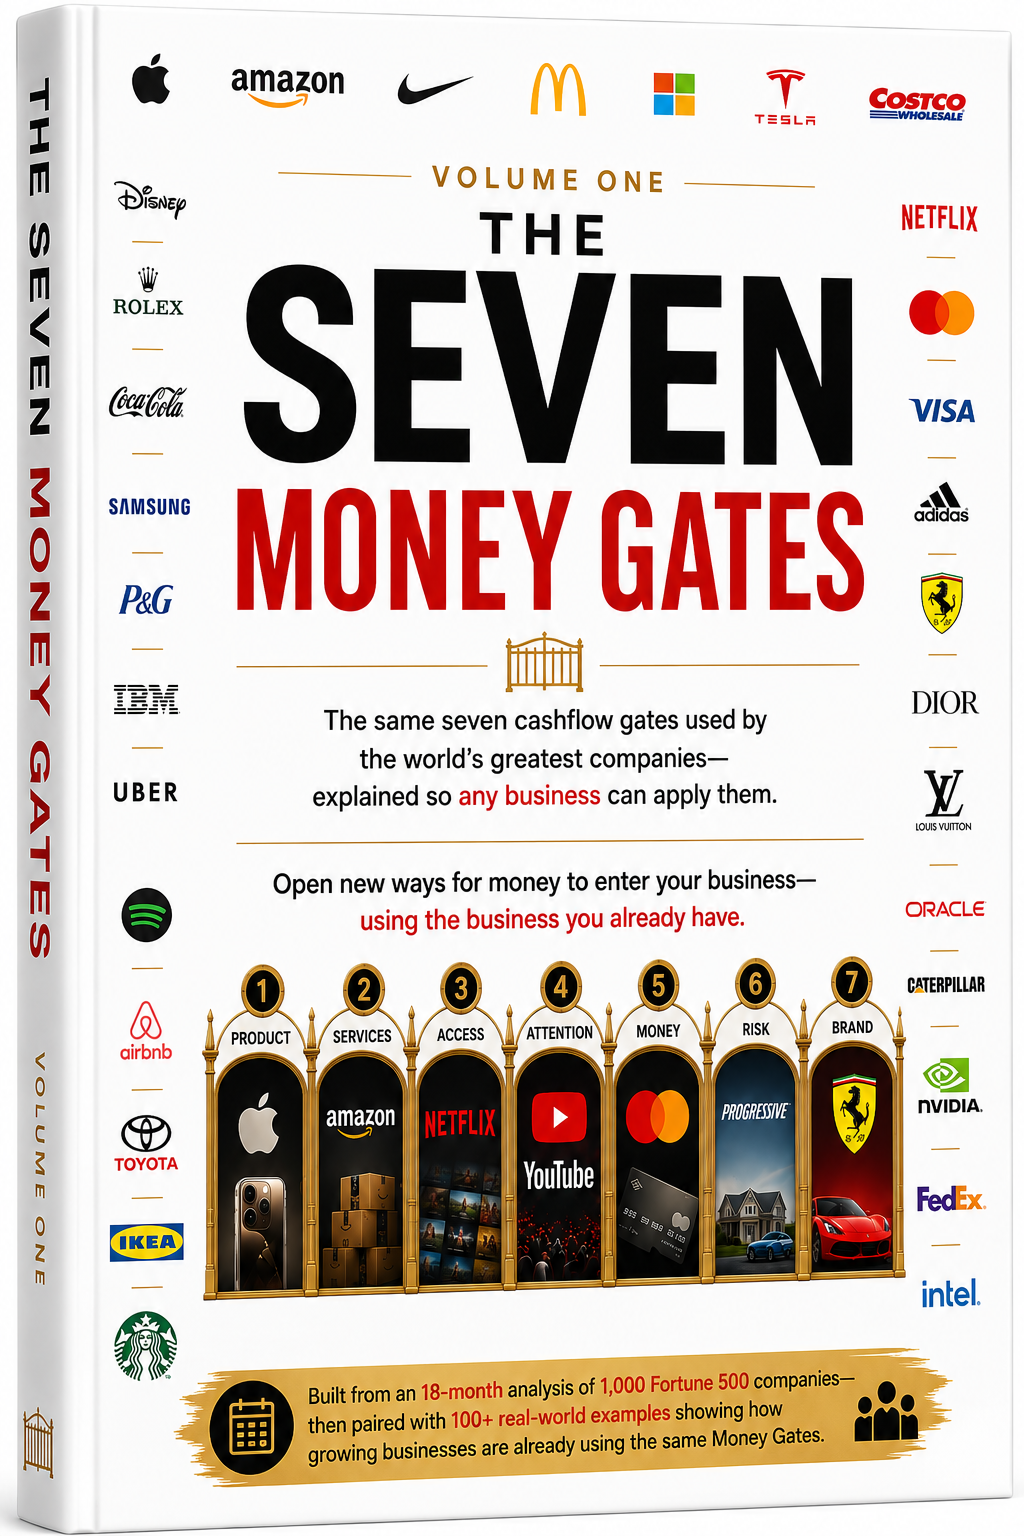
Every business extracts revenue through some combination of these 14 channels — 7 openers, each available in a Physical and a Digital medium. Use this as your reading guide.

PROFIT OPENER PHYSICAL CHANNEL DIGITAL CHANNEL
01 Products Physical Product Sales Tangible goods manufactured, packaged, and sold via retail or direct channels. The classic storefront transaction. Digital Product Sales Downloadable assets, software, templates, or digital files sold as a one-time purchase with zero delivery cost.
02 Services Physical Service Delivery In-person labor, consultations, repairs, or expertise delivered at a physical location or on-site. Digital Service Delivery Remote consulting, virtual coaching, online fulfillment, or any service rendered and delivered through digital channels.
03 Access Physical Access Gate Memberships, entry passes, physical loyalty tiers, or location-based access privileges privileges sold on a recurring basis. Digital Access Gate Subscription plans, SaaS tiers, paywalls, or recurring digital membership fees that gate content or functionality.
04 Attention Physical Attention Capture Billboard placements, event sponsorships, in-store brand shelving, or any physical advertising inventory sold to third parties. Digital Attention Capture Ad revenue, sponsored placements, affiliate arbitrage, or monetizing an owned audience's attention through digital channels.
05 Money Physical Money Mechanics Upfront payment collection, deposit structures, or float optimization — holding cash from physical transactions before fulfillment. Digital Money Mechanics Payment processing spreads, digital float, BNPL integrations, or fintech revenue extracted from digital transaction flow.
06 Risk Physical Risk Coverage Extended warranties, in-store protection plans, insurance products, or physical asset guarantees sold alongside the core product. Digital Risk Coverage Digital warranties, SLA upsells, cybersecurity add-ons, or data backup subscriptions that monetize a customer's fear of loss.
07 Brand Physical Brand Licensing Trademark royalties, franchise licensing fees, co-branding deals, or physical branded merchandise sold to third parties. Digital Brand Licensing IP licensing, white-label software deals, digital co-branding arrangements, or platform platform placement fees paid for brand association.