CASHFLOW ARCHITECTURE BRIEFING // SEASON 1, EPISODE 43 EXECUTIVE INTELLIGENCE BRIEFING
The Walt Disney Company 6/14 ACTIVE GATES

What does Disney Really Sell?

In 1957, Walt Disney sat down with a blank piece of paper and hand-drew a famous pencil diagram that revealed the hidden commercial architecture of his studio: animated feature films were never designed to be the final cash cow; they were the emotional customer acquisition furnace. The world assumes Disney makes its billions by producing animated box-office hits, Marvel blockbusters, and Star Wars theatrical releases. That is what is SEEN.

LIVE MATRIX PREVIEW
THE 7 MONEY GATES™ INTERACTIVE CANVAS

Want to skip the story and explore the interactive matrix showing all the gates this brand uses?

Test your commercial intuition: click to reveal the unseen cash engines, explore all 14 physical & digital gates, and see the exact mechanics this enterprise uses to extract profit.

FORENSIC CASE STUDY

The Mechanics of Disney's Multi-Generational Flywheel

ACT I // THE INCUMBENT BLUNDER 01

The Box Office Rollercoaster

Throughout the Golden Age of Hollywood, traditional film studios—MGM, Paramount, Warner Bros, and RKO—lived and died by a volatile, feast-or-famine business model. Every three years, a studio would wager its entire balance sheet on a slate of new movies. If audiences showed up on opening weekend, the studio survived; if two big films flopped in a row, the studio faced bankruptcy and liquidation.

Traditional studio moguls viewed films as disposable consumer products with a ninety-day commercial lifespan. Once a film left the cinema, its earning power dropped to zero. Studios failed to realize that emotional characters could be transformed into permanent, multi-generational commercial assets.

"Disneyland will never be completed. It will continue to grow as long as there is imagination left in the world."

— Walt Disney (1955)
ACT II // THE STRUCTURAL COUP 02

The Synergy Flywheel & The Real Estate Moat

Walt Disney broke free from the Hollywood box-office trap by designing the entertainment industry's first self-reinforcing commercial flywheel.

In 1955, Disney opened Disneyland in Anaheim, California. Hollywood executives mocked the park, predicting parents wouldn't pay money to walk through a life-sized cartoon set. But Disney understood consumer psychology: a movie creates an emotional bond with a child in 90 minutes, and the theme park allows the parent to step inside that emotion in the physical world.

In this architecture, the theatrical film ceased to be the end product. It became a high-budget commercial funded entirely by ticket buyers. The box office recoups the production outlay upfront, while Disney extracts the real, compounding cash flows through physical theme parks, luxury resort properties, cruise lines, and licensed merchandise over fifty-year lifecycles.

ACT III // THE UNSEEN CASH ENGINES 03

The Three Tollbooths Funding the Magic Kingdom

Disney does not operate as a film studio; it operates as an emotional real estate and intellectual property licensing monopoly.

THE UNSEEN TOLLBOOTHS

How The Cash Actually Moves

01 Access Gate
The $34B+ Experiential Theme Park Ticket Gate

Disney Experiences generates over $34 Billion annually with immense pricing power. Families willingly pay $150+ per day for admission tickets, purchase $30 Lightning Lane line-skipping passes, and book $400-a-night themed resort rooms—operating with software-grade margins on physical real estate.

FORENSIC METRIC $34B+ Experiential Annual Revenue
Source: Disney Experiences Segment Financials
02 Brand Gate
Multi-Billion Dollar Character IP Licensing

Disney licenses its character catalog (Mickey Mouse, Star Wars, Marvel, Frozen) to global toy manufacturers (Hasbro, Lego), clothing brands, and video game developers. Disney takes zero manufacturing risk, collecting multi-billion-dollar royalty checks simply for granting permission to print character faces onto consumer goods.

FORENSIC METRIC Pure Margin Global Character Royalties
Source: Disney Consumer Products Division
03 Access Gate
Disney+ Direct-to-Consumer Digital Annuity

By launching Disney+, Disney established a direct digital billing relationship with over 150 million households. By bundling century-old animated classics with new streaming originals, Disney transformed one-time moviegoers into predictable, recurring monthly subscribers.

FORENSIC METRIC 150M+ Recurring Streaming Subscribers
Source: Disney Direct-to-Consumer SEC Disclosures
THE SEEN ENGINE
$31.40B

Entertainment Box Office & Streaming Revenue

The visible revenue generated from theatrical movie box office tickets, linear TV networks, and Disney+ / Hulu streaming subscriptions.

Source: The Walt Disney Company FY 2024 Entertainment Segment
THE UNSEEN ENGINE
$34.10B+

Theme Parks, Resorts & IP Merchandise Licensing

The high-margin physical theme park ticket gates, hotel resort stays, cruise line bookings, and multi-billion-dollar global toy/apparel character IP royalties.

Source: Disney Experiences Segment Annual Report

The real wealth is in what is NOT SEEN—how Disney channels the emotional equity created on movie screens into an empire of high-margin physical tollbooths: charging families $150 a day for theme park tickets, $400 a night for themed resort hotels, and collecting multi-billion-dollar royalty checks on plastic toys, clothing, and Broadway musicals across multiple generations.

But which money gates does Disney use to stack this cashflow? Click each ? to reveal how they use that gate.

AGENT // PROFIT OPENER THE SEEN (PHYSICAL/DIGITAL) THE UNSEEN (PHYSICAL/DIGITAL)
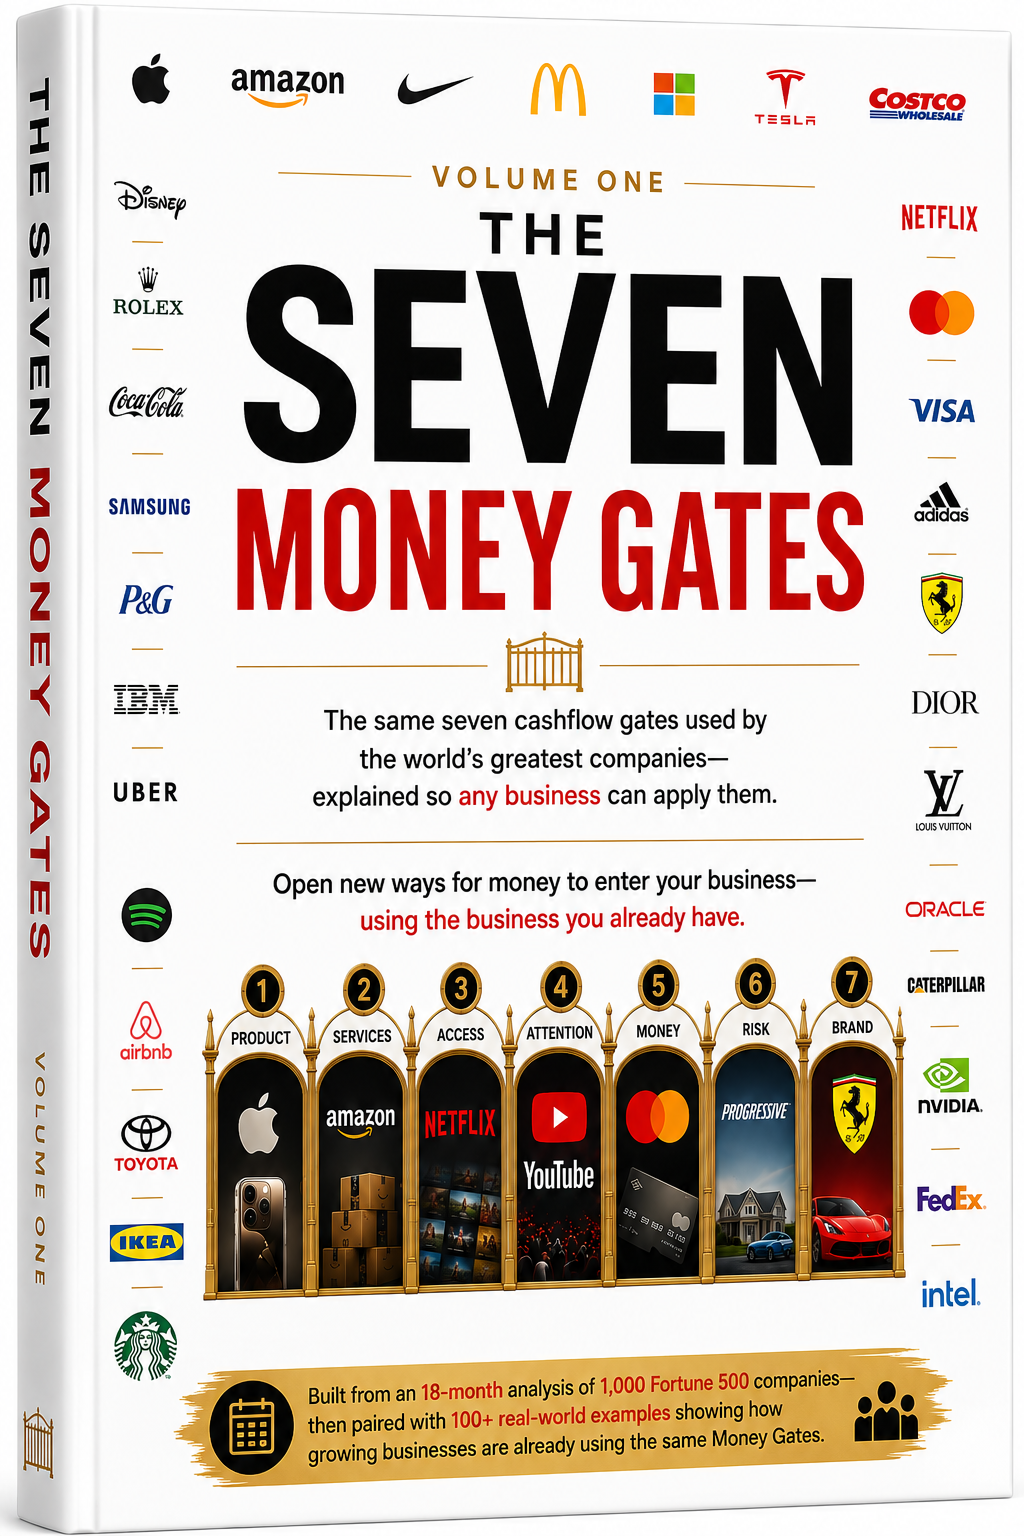
1. Products
ACTIVE · SEEN Theatrical Box Office & Streaming Content Producing animated feature films, superhero movies, and streaming series. Source: The Walt Disney Company FY2024 Form 10-K, Consumer Products Licensing Disclosures
ACTIVE · SEEN Unknown
—
2. Services — —
3. Access —
4. Attention — —
5. Money — —
6. Risk — —
7. Brand —
STEP 03

Strategic Translation

The underlying economic infrastructure driving this profit extraction design.

01

What is the explicit promise the customer buys?

Animated feature films, superhero movies in theaters, and Disney+ mobile apps.

02

What asset is quietly accumulating as a result?

A century of world-famous character intellectual property (Mickey, Marvel, Star Wars, Pixar) embedded into global culture.

STEP 04

Boardroom Strategy Takeaway

Commercial architecture analysis & operational directives for executive decision-makers.

PO
EXECUTIVE STRATEGY TAKEAWAY

Do not expect your primary content or marketing output to generate all your profits. Use high-quality content as a low-margin attention engine to build emotional attachment, then monetize that attention through high-margin physical experiences or brand licensing.

FOR SMEs & OPERATORS Pragmatic Implementation

Prerequisite Condition: Apply this when you produce media, content, or educational material that builds a passionate fan base or dedicated community.

Actionable Blueprint: A local culinary chef creates a free YouTube cooking channel showing recipes. The YouTube ad revenue is minimal ($300/mo). However, the chef uses the channel's authority to launch a high-ticket 'Weekend Culinary Immersion Retreat' (Access - Physical) at a luxury farm resort ($2,500/head for 15 guests). The chef makes $37,500 in pure profit weekend retreat income powered by a 'free' video content engine.

📖 VIEW THE 14 PROFIT OPENERS FRAMEWORK GUIDE ▼
THE FRAMEWORK // FOR REFERENCE

The 14 Profit Openers Explained

Every business extracts revenue through some combination of these 14 channels — 7 openers, each available in a Physical and a Digital medium. Use this as your reading guide.

PROFIT OPENER PHYSICAL CHANNEL DIGITAL CHANNEL
01 Products Physical Product Sales Tangible goods manufactured, packaged, and sold via retail or direct channels. The classic storefront transaction. Digital Product Sales Downloadable assets, software, templates, or digital files sold as a one-time purchase with zero delivery cost.
02 Services Physical Service Delivery In-person labor, consultations, repairs, or expertise delivered at a physical location or on-site. Digital Service Delivery Remote consulting, virtual coaching, online fulfillment, or any service rendered and delivered through digital channels.
03 Access Physical Access Gate Memberships, entry passes, physical loyalty tiers, or location-based access privileges privileges sold on a recurring basis. Digital Access Gate Subscription plans, SaaS tiers, paywalls, or recurring digital membership fees that gate content or functionality.
04 Attention Physical Attention Capture Billboard placements, event sponsorships, in-store brand shelving, or any physical advertising inventory sold to third parties. Digital Attention Capture Ad revenue, sponsored placements, affiliate arbitrage, or monetizing an owned audience's attention through digital channels.
05 Money Physical Money Mechanics Upfront payment collection, deposit structures, or float optimization — holding cash from physical transactions before fulfillment. Digital Money Mechanics Payment processing spreads, digital float, BNPL integrations, or fintech revenue extracted from digital transaction flow.
06 Risk Physical Risk Coverage Extended warranties, in-store protection plans, insurance products, or physical asset guarantees sold alongside the core product. Digital Risk Coverage Digital warranties, SLA upsells, cybersecurity add-ons, or data backup subscriptions that monetize a customer's fear of loss.
07 Brand Physical Brand Licensing Trademark royalties, franchise licensing fees, co-branding deals, or physical branded merchandise sold to third parties. Digital Brand Licensing IP licensing, white-label software deals, digital co-branding arrangements, or platform platform placement fees paid for brand association.